Think Like a Lender
How a Commercial Lender Reads Your Finances (and How to Read Your Own)
For most of my career, my job has been to read other people’s finances. A business owner sends over tax returns, bank statements and a balance sheet, and I have to answer one deceptively simple question: if we lend this money, how does it come back?
Somewhere along the way I noticed I had never asked that question about my own household with the same rigor. I was careful with clients’ numbers and casual with mine. When I finally underwrote myself the way I’d underwrite a borrower, it changed how I saved, how I borrowed and, eventually, how I bought rental property.
This post walks through the framework lenders have leaned on for generations, the Five C’s of credit, and turns it into a personal financial health check you can do this weekend with a spreadsheet and a cup of coffee.
Why think like a lender at all?
A lender isn’t trying to guess whether you’ll get rich. A lender is trying to figure out what happens if things go wrong. That’s a healthy lens for anyone working toward financial independence, because plans rarely fail on the upside. They fail when a job wobbles, the roof leaks and the insurance renewal shows up in the same quarter.
Lenders also have a habit worth stealing: they write it down. A credit memo forces you to state the numbers plainly, name the risks and explain why the deal still works. Most households never do that.
The Five C’s, translated for households
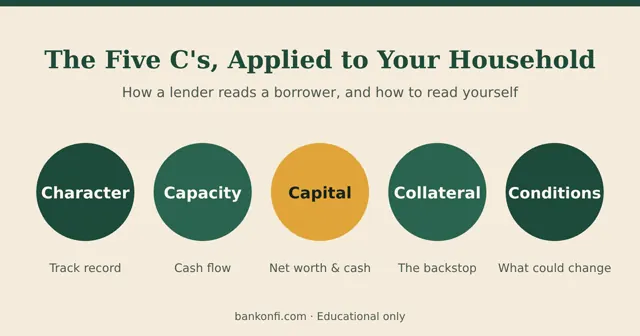
1. Character: do you do what you say?
For a business, character shows up as credit history, how the owner handled tough years and whether the financials arrive clean and on time. For you, it’s your credit report, your payment history and an honest answer to a simple question: when you set a budget or a savings goal, do you usually hit it?
Personal check: pull your free credit reports and look for late payments or errors. Then compare the last six months of spending against whatever plan you had.
2. Capacity: can your cash flow carry your debts?
This is the big one. Lenders want to see that recurring cash flow covers debt payments with room to spare. In commercial lending, that’s the debt service coverage ratio (DSCR). A DSCR of 1.25x means there’s $1.25 of cash flow available for every $1.00 of debt payments.
For a household, I use a simple version:
Personal coverage ratio = (take-home pay − living expenses) ÷ monthly debt payments
Above 1.0x, your income covers your debts. The further above 1.0x, the more cushion you have when something breaks.
3. Capital: what have you built, and what’s actually available?
Net worth matters, but lenders care even more about liquidity. Home equity and retirement accounts are real wealth, but you can’t pay a surprise bill with them quickly or cheaply. That’s why lenders “haircut” assets, counting less than full value for anything that’s slow or costly to turn into cash.
Personal check: count your months of liquidity: cash (plus a haircut share of taxable investments) divided by your essential monthly outflow.
4. Collateral: what’s the backstop?
Collateral protects the lender if everything else fails. For a household, the useful question is: what could you sell or borrow against in a real emergency, and how much equity cushion is there? Loan-to-value (LTV) compares what you owe on an asset with what it’s worth. The lower it is, the more of it is truly yours.
5. Conditions: what could change?
Every credit memo has a section on outside risks: the industry, the economy, interest rates and the purpose of the loan. For you, that means job stability, whether your income depends on one employer or one client, variable-rate debt that could reset, and costs that tend to jump. (If you live somewhere like Florida, put insurance renewals on this list in bold.)
A worked example (hypothetical numbers)
Meet Alex and Morgan. They aren’t real, and every number below is made up for illustration, but they look like a lot of households I’d expect to read this blog: two incomes, a house, a car loan, solid retirement savings and a goal of reaching FI before 55.
- Gross household income: $165,000 a year ($13,750 a month)
- Take-home pay after taxes, benefits and 401(k) contributions: $9,400 a month
- Debt payments: mortgage with taxes and insurance $3,100, car $550, student loan $350, for a total of $4,000 a month
- Other living costs (food, utilities, childcare, everything else): $3,900 a month
Capacity. Take-home minus living costs is $5,500. Divide by $4,000 of debt payments and their personal coverage ratio is 1.38x. They have about $1,500 a month left over. For context, their debt-to-income ratio (debt payments divided by gross income) is about 29%.
Stress test. Now do what a credit committee would do and lean on it. Suppose take-home pay drops 15% (a job change, lost bonus or reduced hours) to $7,990, and living costs rise 5% to $4,095. Coverage falls to $3,895 ÷ $4,000 = 0.97x. In that scenario, they’re about $105 a month short before saving a dime.
Capital. On paper, their assets are a $520,000 home, $210,000 in retirement accounts, $40,000 in a brokerage account, $18,000 in cash and $30,000 of cars, for a total of $818,000. Against $440,000 of debt, their net worth is $378,000.
A lender-style view is more conservative. Leave out the cars, haircut retirement and brokerage accounts by 30% for taxes, penalties and market swings, and adjusted net worth is closer to $273,000.
Liquidity. Essential monthly outflow (living costs plus debt payments) is $7,900. Cash alone covers 2.3 months. Add 70% of the brokerage account and they reach about 5.8 months.
Collateral. The home carries a $390,000 mortgage on a $520,000 value, which works out to 75% LTV and about $130,000 of equity.
Here’s their one-page memo:
| Measure | Alex & Morgan (hypothetical) |
|---|---|
| Personal coverage ratio | 1.38x |
| Coverage after stress test | 0.97x |
| Debt-to-income | 29% |
| Net worth (as reported) | $378,000 |
| Net worth (lender view) | ~$273,000 |
| Liquidity, cash only | 2.3 months |
| Home loan-to-value | 75% |
What I’d take away from that memo
Alex and Morgan aren’t in trouble. They’re doing a lot right. But the memo surfaces three things a quick glance at their 401(k) balance wouldn’t:
- The cushion is thinner than it feels. 1.38x sounds comfortable, yet a fairly ordinary setback pushes them below 1.0x.
- Liquidity is the weak spot. Two-plus months of cash is a short runway for a two-income household with a mortgage.
- Net worth isn’t the same as spendable wealth. About a quarter of it disappears under a lender’s haircut.
None of this tells them what to do, and it isn’t meant to. It gives them better questions. Build cash before investing more? Pay off the car to lift coverage? Wait before adding a rental, which brings its own debt into the ratio? Those are their decisions, ideally made with a professional who knows their full picture.
Run your own memo this weekend
- List your take-home pay, essential living costs and every monthly debt payment.
- Calculate your personal coverage ratio.
- Stress it: cut income 15% and raise costs 5%. Are you still above 1.0x?
- Count your months of liquidity, cash first and then with a haircut on investments.
- Write your net worth twice: the normal way and the lender way.
- Write three sentences under “Conditions” about what could realistically change in the next 12 months.
Then do the most lender-like thing of all: put a date at the top and do it again in six months. The trend tells you more than any single snapshot.
Next up, I’ll take the coverage ratio to rental property and show how one number decides whether a rental survives a bad year. If you’d like the spreadsheet version for rentals, that’s what The Lender’s Rental Stress-Test Kit is for.
Get the Stress-Test Kit
Run a rental through the same stress tests a credit committee would. Free, with the every-other-week newsletter.